
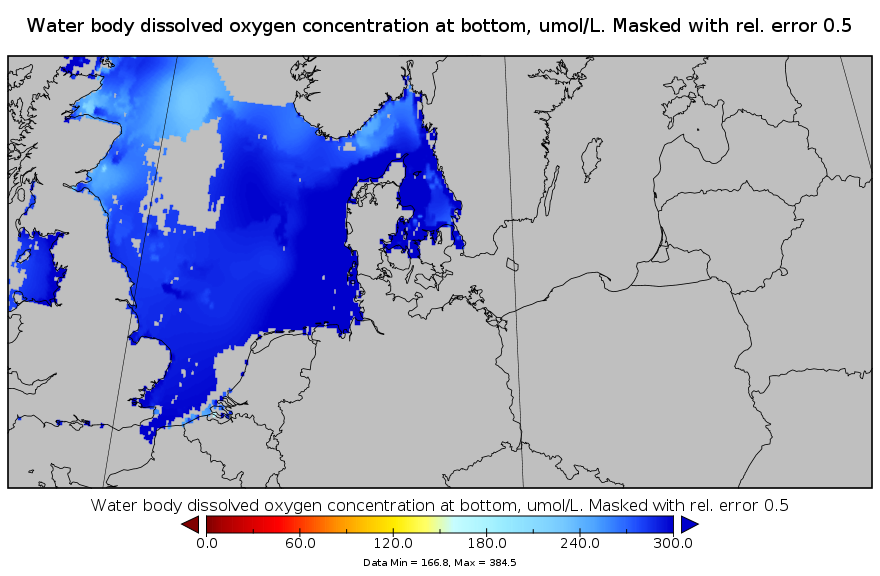
North Sea DIVA 4D analysis of Water_body_dissolved_oxygen_concentration
This gridded product visualizes 1960 - 2014 water body dissolved oxygen concentration (umol/l) in the North Sea domain, for each season (winter: December – February; spring: March – May; summer: June – August; autumn: September – November).
It is produced as a Diva 4D analysis, version 4.6.11: a reference field of all seasonal data between 1960-2014 was used; results were logit transformed to avoid negative/underestimated values in the interpolated results; error threshold masks L1 (0.3) and L2 (0.5) are included as well as the unmasked field.
Every step of the time dimension corresponds to a 10-year moving average for each season.
The depth dimension allows visualizing the gridded field at various depths.
Data and resources
-
HTML Open
-
OPeNDAP (winter)HTML Open
-
OPeNDAP (spring)HTML Open
-
OPeNDAP (summer)HTML Open
-
OPeNDAP (autumn)HTML Open
-
PNG Open
-
PNG Open
-
HTML Open
-
HTML Open
-
HTML Open
-
HTML Open
-
HTML Open
-
HTML Open
-
HTML Open
-
HTML Open
-
HTML Open
-
HTML Open
-
HTML Open
-
HTML Open
-
HTML Open
-
HTML Open
-
HTML Open
-
HTML Open
-
HTML Open
-
HTML Open
-
HTML Open
-
HTML Open
-
HTML Open
-
HTML Open
-
HTML Open
-
HTML Open
-
HTML Open
-
HTML Open
-
HTML Open
-
HTML Open
-
HTML Open
-
HTML Open
-
HTML Open
-
HTML Open
-
HTML Open
-
HTML Open
-
HTML Open
-
HTML Open
-
HTML Open
-
HTML Open
-
HTML Open
-
HTML Open
-
HTML Open
-
HTML Open
-
HTML Open
-
HTML Open
-
HTML Open
-
HTML Open
-
HTML Open
-
HTML Open
-
HTML Open
-
HTML Open
-
HTML Open
-
HTML Open
-
HTML Open
Additional information
| Temporal extent | 1960-03-01 – 2014-11-30 |
|---|---|
| Date (creation) | 2015-10-13 |
| Status | onGoing |
| Update frequency | asNeeded |
| Metadata language | en |
| License | Creative Commons Attribution 4.0 |
| Source metadata | ISO 19115 XML |
| Last updated | 2026-11-04 |
| Created | 2026-11-04 |
| API | package_show |